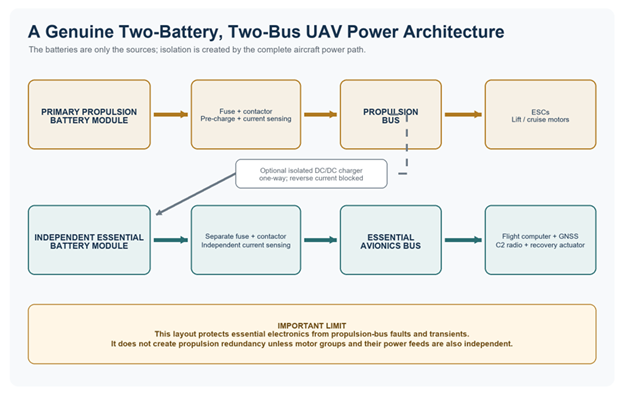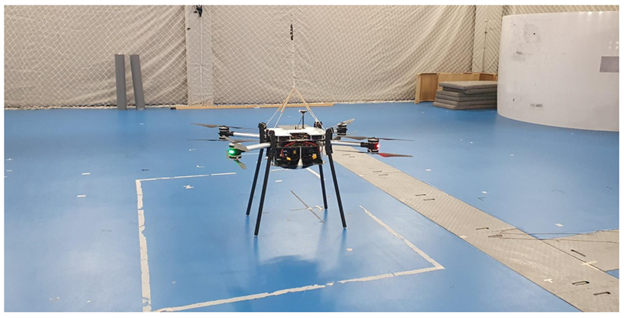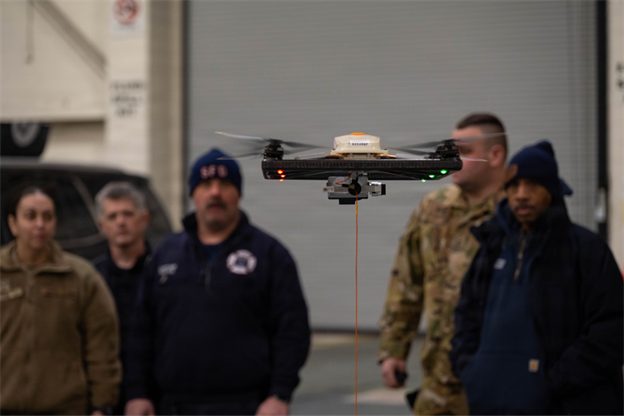
A higher gravimetric energy density can create more range potential, but it cannot tell an operator how long a VTOL drone will remain safely airborne. Real endurance is decided by the complete battery pack, the aircraft and the mission they must survive together.
Battery buyers naturally look for one clean number. Watt-hours per kilogram, or Wh/kg, appears to provide it: more stored energy for every kilogram carried. The metric is essential when comparing cells and packs, yet it is often asked to do a job it was never designed to do. A laboratory Wh/kg figure does not contain the power peaks of vertical takeoff, voltage sag at low state of charge, heat trapped inside a pack, payload, wind, reserve policy or battery aging. None of those effects is optional in a real VTOL mission.
This distinction matters as industrial UAVs move into heavier logistics, inspection, mapping and remote operations. A credible endurance forecast must answer two separate questions: how much energy is installed, and how much of that energy remains usable while voltage, temperature and safety limits are respected. Wh/kg helps with the first question. It cannot answer the second by itself.
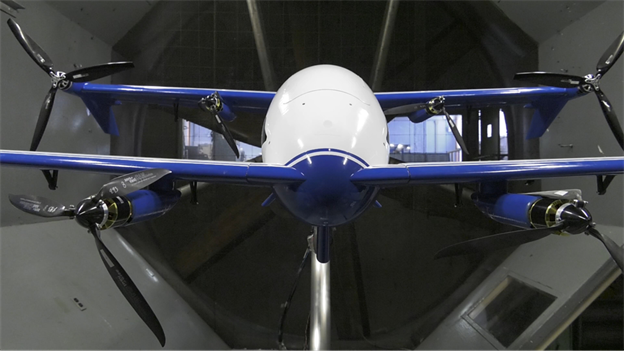
NASA’s Langley Aerodrome No. 8 (LA-8), a modular unmanned electric VTOL research aircraft, during wind-tunnel testing. Its eight-propeller configuration illustrates why aircraft architecture and mission power demand matter alongside battery Wh/kg. Image: NASA [7].
Wh/kg answers one question — and only one
Gravimetric energy density is energy divided by mass. At cell level, it describes the electrochemical unit. At pack level, the denominator also includes interconnects, insulation, enclosure, battery-management electronics, temperature sensors, contactors, fuses, mounting hardware and, where required, cooling or containment. An aircraft never flies a bare cell. It flies the whole energy-storage system.
NASA’s cell-to-pack scaling study gives a useful aviation example: 225 Wh/kg cells were used in the X-57 battery, while the completed pack achieved 149 Wh/kg [1]. That single example should not be turned into a universal conversion factor. NASA’s larger point is more important: the cell-to-pack penalty is not constant, and simply doubling cell energy density does not automatically double pack energy density. Thermal, structural and operational safety requirements do not shrink in a perfectly linear way as chemistry improves.
The DJI DB2000 offers a current commercial reference at pack level. DJI publishes 1,984.4 Wh of energy and an approximate mass of 11.3 kg [3]. Dividing those official values gives about 175.6 Wh/kg for the complete battery. That derived number is useful because the basis is explicit. A supplier quoting 350 or 400 Wh/kg without saying “cell” or “pack” is not providing enough information for aircraft sizing.
A VTOL mission is a power waveform, not a steady discharge
Laboratory energy tests are commonly performed under defined, repeatable discharge conditions. A VTOL aircraft does not draw power that way. Hover, vertical climb, transition, forward cruise, loiter, gust response, go-around and landing each create a different load. The battery therefore sees a sequence of peaks and recovery periods rather than one smooth line.
That difference changes the engineering problem. Energy, measured in Wh, determines how much work may be available over time. Power, measured in W, determines whether the pack can support the aircraft at a particular instant. Because electrical power is voltage multiplied by current, a falling terminal voltage can require more current to sustain the same propulsion power. Higher current deepens voltage sag and raises resistive heating. A pack may contain energy on paper while being temporarily unable to deliver the power required for the next climb or landing.
The same aircraft can have very different published endurance figures
DJI’s official FlyCart 30 data illustrates why configuration and load must accompany every endurance claim. In controlled conditions at zero altitude and without wind, DJI lists 29 minutes of empty-weight hover in dual-battery mode and 15 minutes in single-battery mode. At maximum weight, the published figures are 18 minutes with a 30 kg payload and dual batteries, and 8 minutes with a 40 kg payload and one battery [3]. These are not chemistry comparisons, and the two loaded cases are not like-for-like because the payloads differ. That is exactly the point: aircraft-level endurance is conditional.
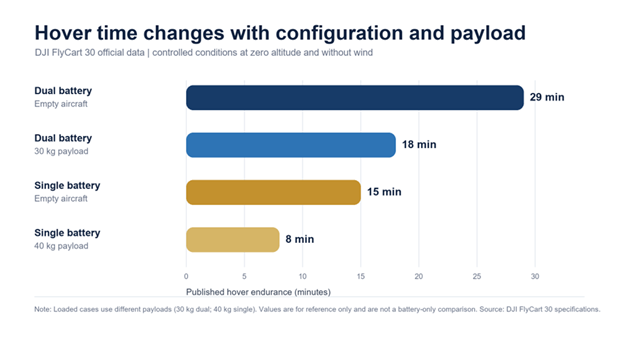
Official FlyCart 30 hover-endurance figures by battery configuration and payload. Test conditions: zero altitude and no wind; DJI states that the values are for reference only. Loaded cases use different payloads and should not be treated as a controlled battery-only comparison. Source: DJI [3].
A single Wh/kg value cannot predict these results. To do so, a model needs installed watt-hours, total aircraft mass, propulsion efficiency, hover and cruise power, the duration of each mission segment, allowable discharge current, voltage limits, temperature limits and reserve. Change any one of those inputs and the answer moves.
Voltage sag can end the mission with energy still in the pack
A 2026 Journal of Energy Storage study makes the failure mechanism unusually clear. The researchers evaluated four realistic missions for a hybrid VTOL UAV: baseline delivery, short-hop delivery, extended surveillance loiter and emergency climb. Feasibility was judged against a 16.2 V operational cutoff and a 60°C battery-core temperature limit [2]. In other words, the mission did not pass merely because nominal capacity existed. Voltage and thermal boundaries also had to remain intact.
The baseline 6S1P propulsion pack was voltage-limited in the delivery missions and suffered both voltage and thermal failure in the long surveillance mission. Yet it remained feasible for the short emergency operation because thermal mass delayed the temperature rise. When the architecture was changed to 6S2P, every modeled mission became feasible. The parallel configuration raised minimum pack voltage by 2.0 to 3.5 V and lowered peak core temperature by 27.9 to 37.9°C [2].
This is not proof that doubling every UAV pack will produce the same result. It is evidence that architecture changes the usable mission envelope even when the underlying cell chemistry is unchanged. Splitting current across parallel cells reduces per-cell electrical stress, while greater thermal mass changes the temperature trajectory. A Wh/kg-only comparison misses both mechanisms.
Evidence snapshot: what the published data actually shows
| Evidence | Published figure | What it supports |
| NASA X-57 cell-to-pack example [1] | 225 Wh/kg cells; 149 Wh/kg pack | Cell energy density cannot be copied directly into an aircraft mass model. |
| VTOL model limits [2] | 16.2 V cutoff; 60°C core limit | Mission feasibility depends on voltage and heat, not nominal capacity alone. |
| 6S2P versus 6S1P [2] | +2.0 to +3.5 V minimum voltage; 27.9 to 37.9°C lower peak core temperature | Pack architecture can recover a mission that the baseline pack cannot complete. |
| DJI DB2000 [3] | 1,984.4 Wh; approx. 11.3 kg; derived 175.6 Wh/kg | State whether energy density is cell-level or pack-level and show the inputs. |
| FlyCart 30 hover [3] | 29, 18, 15 and 8 minutes across published configurations | Battery count, payload and test conditions belong beside the endurance number. |
| NASA D-Site [4] | Pack tests; up to 50,000 ft; −70 to +180°C facility range | Aviation batteries require environmental and pack-level validation. |
Figures above are quoted from the cited sources; 175.6 Wh/kg is calculated from DJI’s published energy and approximate mass. The figures describe different systems and are not a chemistry ranking.
Heat is a mission constraint, not a footnote
Resistive power loss scales approximately with I²R. That makes short high-power segments disproportionately important. Temperature also changes resistance and available power, so the relationship is coupled: current creates heat, heat changes the cell, and the changed cell alters voltage behavior. Surface temperature alone may not reveal the hottest point inside a densely packaged module.
NASA’s D-Site demonstrates how seriously aviation treats this problem. The facility performs non-destructive pack-level tests for energy capacity, voltage, and charge-discharge cycling. Its capabilities include an altitude chamber up to 50,000 ft, environmental measurements from −70 to +180°C, a thermal camera, redundant battery-temperature monitoring and automatic abort functions [4]. These are facility limits, not recommended UAV operating temperatures. Their value is that they expose the distance between a room-temperature cell result and an aviation-ready pack.
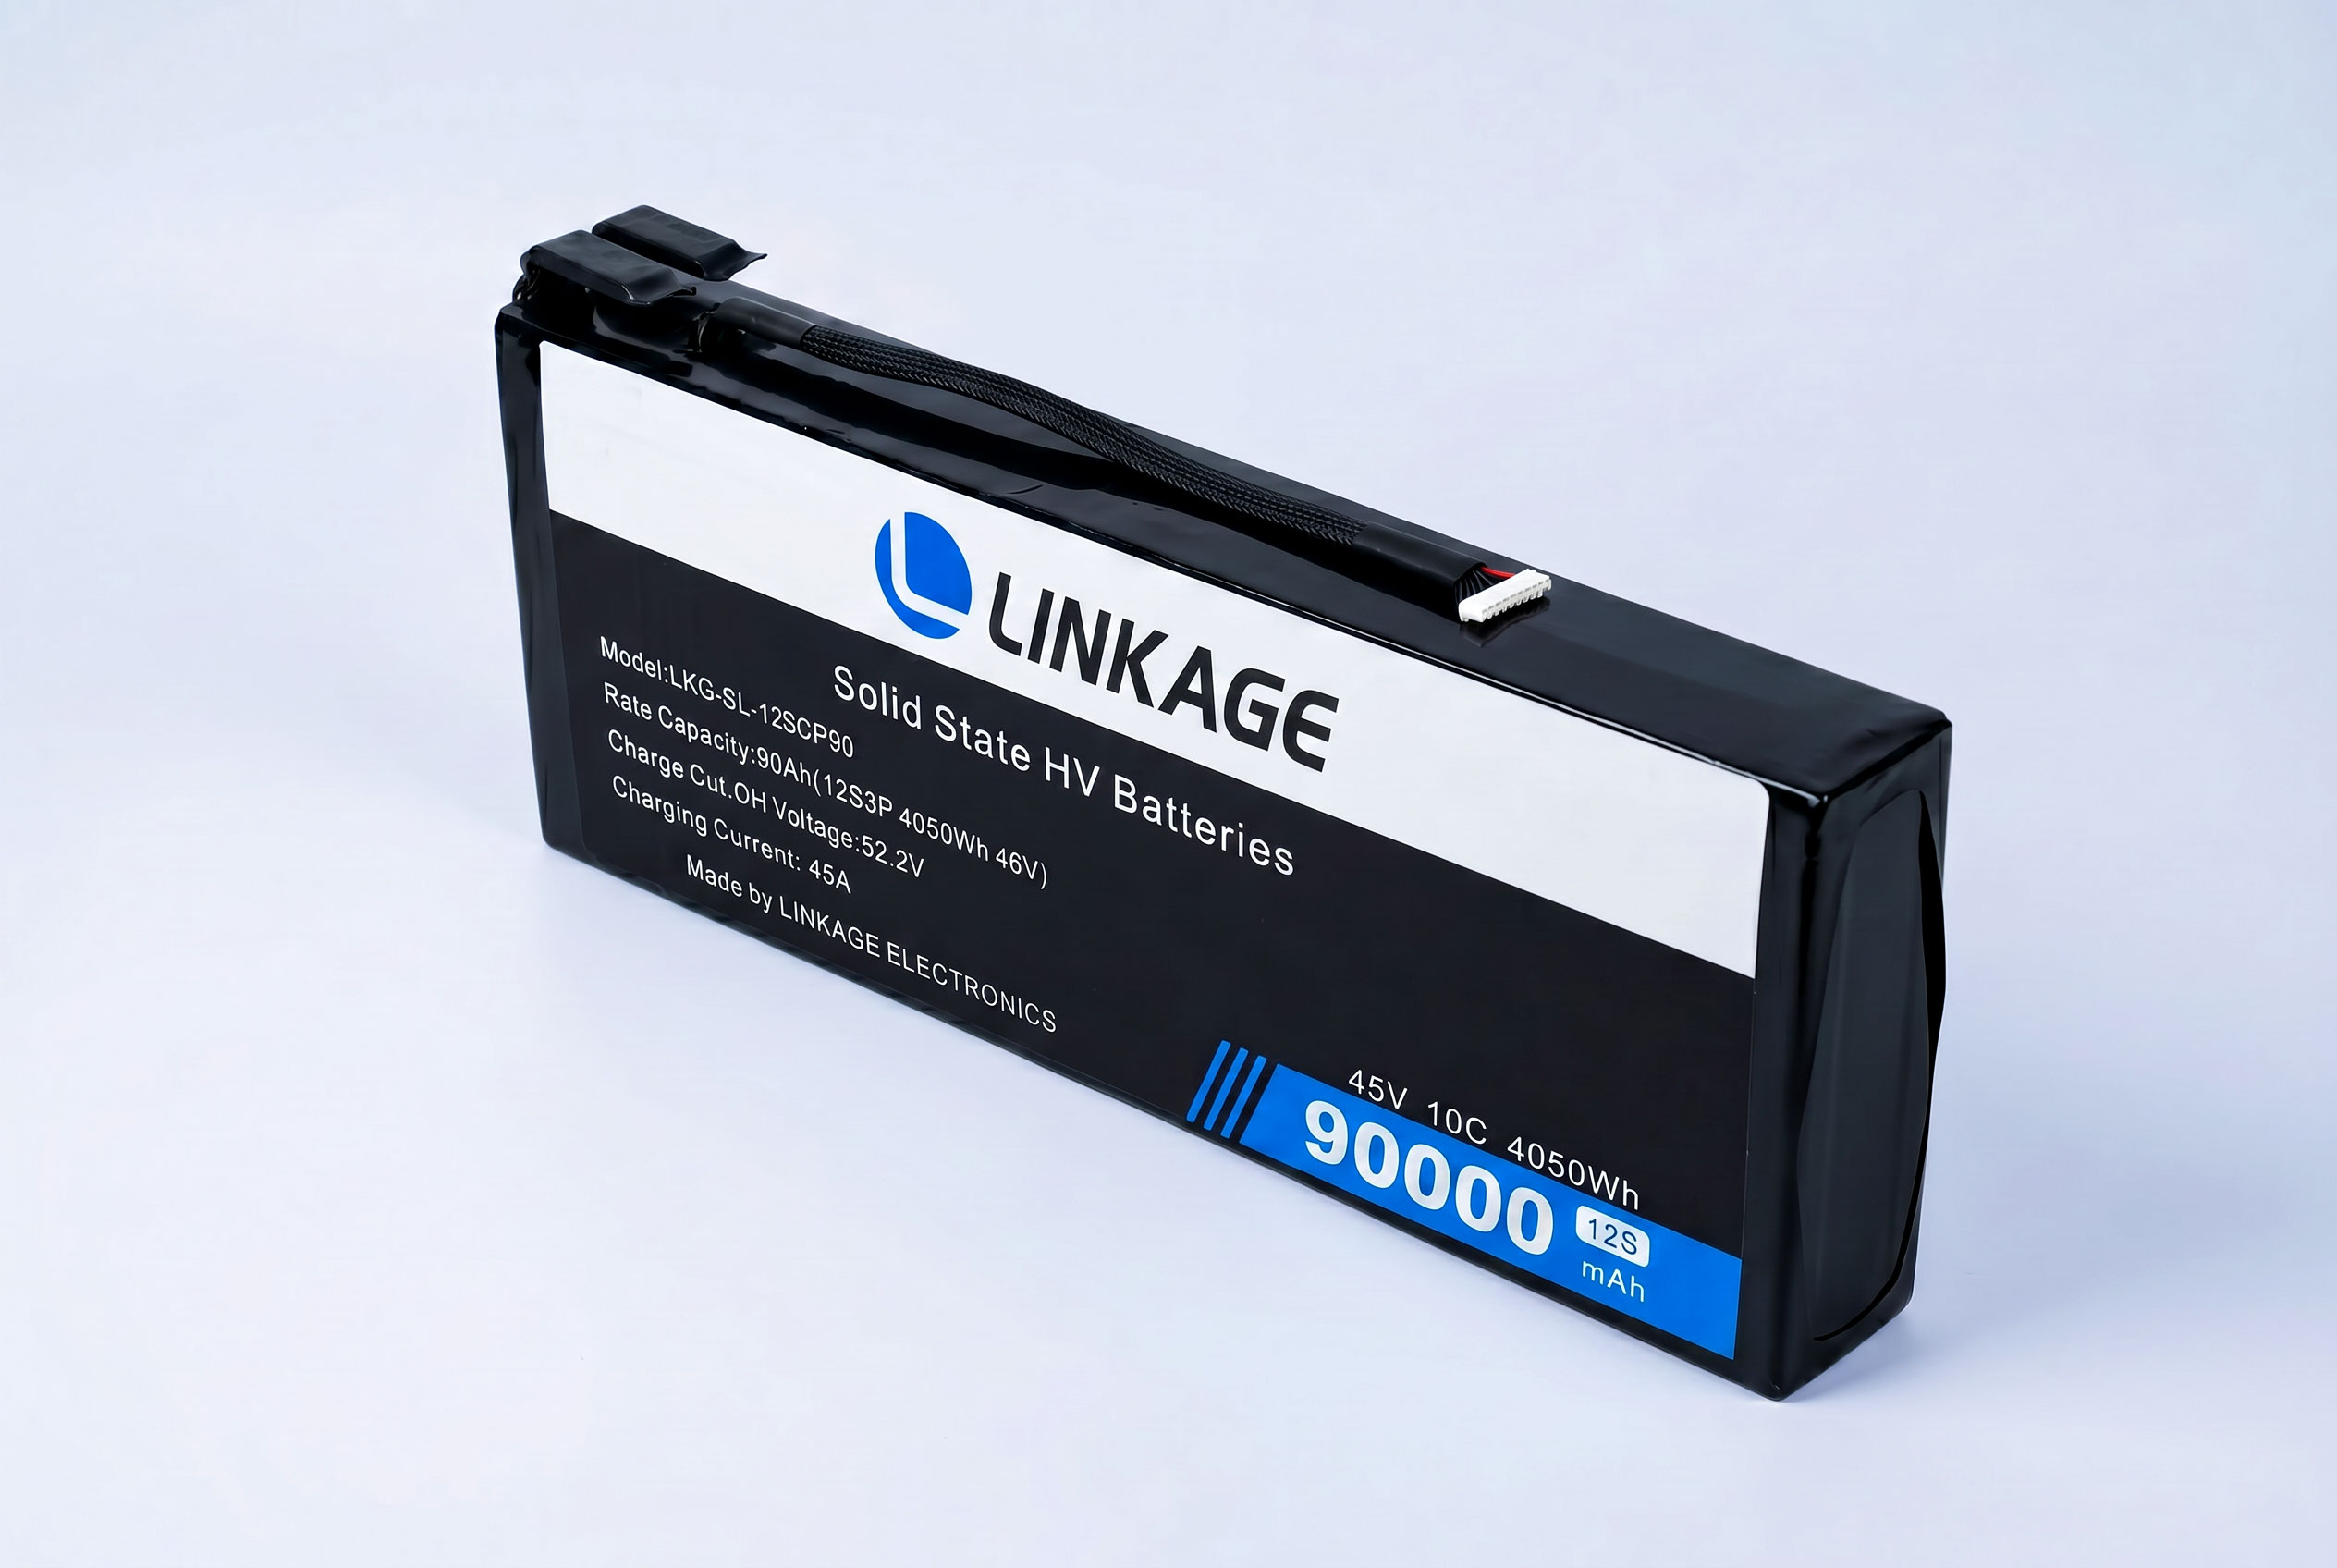
A soft-pouch lithium-polymer UAV battery pack with high-current and balance leads. Even a lightweight flight pack must be evaluated for voltage sag, temperature, current limits and landing reserve under the intended mission profile. Image: LKGHK product photograph [8].
Payload, wind, altitude and reserve rewrite the answer
Payload increases the thrust required to hover and climb. Wind can raise power demand, increase flight time and require more control corrections. Air density changes with altitude and temperature, affecting rotor performance and cooling. A logistics flight may spend substantial time hovering during pickup and delivery, while a hybrid fixed-wing platform may consume most energy in cruise but still need a protected power margin for vertical landing. Two aircraft using packs with identical Wh/kg can therefore return very different endurance.
Reserve policy creates another gap between maximum and usable energy. A test that continues until the displayed battery reaches zero is not the same as an operational mission that must retain energy for diversion, a missed approach, unexpected wind or battery imbalance. NASA’s work on electric-aircraft discharge prediction treats future power demand, auxiliary electrical loads and uncertainty as part of flight-plan safety [5]. More recent NASA octocopter research likewise evaluates remaining flying time from measured voltage, current and temperature profiles rather than assuming that nominal capacity alone predicts landing time [6].
Aging turns a fixed label into a moving target
The rated energy and power capability of a new pack will not remain unchanged throughout its service life. Capacity fade reduces stored energy, while resistance growth increases voltage sag and heat under load. Cell imbalance can make one series group reach its limit before the pack-level state-of-charge estimate reaches its lower threshold. Connector wear, cooling degradation and low-temperature operation can further narrow the usable envelope.
For fleet operations, endurance should therefore be predicted from state of energy, state of health, temperature and the planned mission—not from nameplate Wh/kg alone. A mature BMS should preserve time-stamped voltage, current and temperature data, cycle count and faults so the operator can identify drift before it becomes an in-flight surprise.
High-Wh/kg semi-solid packs still matter — when the claim is complete
None of this makes high energy density unimportant. A well-engineered semi-solid battery can create real aircraft value by reducing pack mass for a required energy target or adding energy without consuming the entire payload budget. That advantage can support longer cruise, a larger reserve or additional mission equipment. But the commercially meaningful figure is pack-level usable energy under the aircraft’s actual current and temperature profile.
The strongest supplier position is therefore not “our chemistry has the highest Wh/kg.” It is “we can document our complete pack’s energy, power, thermal behavior, BMS protection, aging and flight performance under stated conditions.” High energy density opens the design space. Integration evidence turns that potential into a dependable UAV product.
What a serious VTOL battery buyer should request
A useful quotation package should let an aircraft engineer trace and evaluate the claim. At minimum, request:
- Measurement basis — identify whether Wh/kg is measured at cell, module or complete pack level, and state the discharge rate, temperature and voltage window used.
- Complete electrical specification — provide total Wh, nominal voltage, rated Ah, continuous current, peak current and permitted peak duration, not just capacity.
- Dynamic power evidence — show voltage sag, internal resistance and delivered energy across relevant state-of-charge and temperature points.
- Thermal evidence — report sensor locations, peak core and surface temperatures, cooling assumptions and BMS derating or cutoff behavior.
- Aircraft-level validation — name the aircraft, takeoff mass, payload, route, hover ratio, speed, wind, altitude, ambient temperature and landing reserve.
- Life and traceability — include cycle-life conditions, state-of-health method, cell matching, BMS logs, cycle count and fault records.
- Integration and transport readiness — document connectors, communications, enclosure, redundancy, charger, UN 38.3 status and shipment configuration.
This information replaces a marketing estimate with an auditable engineering case. It also protects suppliers: when test conditions are explicit, customers are less likely to apply one aircraft’s result to an incompatible platform.
A better way to forecast endurance
Start with the mission, not the chemistry. Define every flight segment and the required reserve. Estimate the aircraft’s time-varying power demand at realistic mass, weather and altitude. Model the pack’s voltage and heat response using measured cell data and pack resistances. Apply BMS, voltage, current and temperature limits. Add aging and uncertainty. Then validate the result with instrumented ground tests and progressively representative flights.
The result should be a mission envelope, not one heroic endurance number. A useful envelope shows how payload, ambient temperature, wind, state of health and reserve change safe flight time. That is the information an operator can plan around and a procurement team can compare.
Conclusion
Laboratory Wh/kg is a valuable starting point because it reveals energy-storage potential. It is not a flight-time calculator. VTOL endurance emerges from cell chemistry, pack overhead, architecture, voltage stability, thermal behavior, aircraft efficiency, payload, environment, aging and operational reserve. The 2026 mission-profile research is especially instructive: one battery architecture failed on voltage and heat while another, using a parallel configuration, completed the modeled missions, even though the comparison was not built on a new chemistry headline.
For drone manufacturers and fleet buyers, the practical rule is simple: use Wh/kg to begin the conversation, then demand mission-profile evidence to finish it. The battery that looks best in a laboratory table is not automatically the battery that keeps a VTOL aircraft safely airborne the longest.
Sources
[1] Chin, J. C., Look, K., McNichols, E. O., Hall, D. L., Gray, J. S., and Schnulo, S. L. “Battery Cell-to-Pack Scaling Trends for Electric Aircraft.” NASA Glenn Research Center / AIAA-IEEE EATS, 2021. https://ntrs.nasa.gov/citations/20210017488
[2] Kaya, M. F. “Mission profile based electrochemical-thermal battery modeling for vertical take-off and landing aerial vehicles.” Journal of Energy Storage, Vol. 176, 2026, Article 123342. https://doi.org/10.1016/j.est.2026.123342
[3] DJI. “FlyCart 30 — Specifications.” Aircraft endurance and DB2000 Intelligent Battery specifications. https://www.dji.com/flycart-30/specs
[4] NASA. “D-Site.” Official aviation battery and electric-powertrain test-facility page, last updated 4 May 2026. https://www.nasa.gov/eap-labs-and-testbeds/d-site/
[5] Bole, B., Daigle, M., and Gorospe, G. “Online Prediction of Battery Discharge and Estimation of Parasitic Loads for an Electric Aircraft.” NASA Ames Research Center / European Conference of the PHM Society, 2014. https://ntrs.nasa.gov/citations/20190001777
[6] Hogge, E. F., Kulkarni, C. S., Eure, K. W., et al. “Performance of Two Battery Prognostic Applications used by Two Octocopters for Safe Low Altitude Autonomous Flight Operations.” NASA Technical Memorandum, June 2024. https://ntrs.nasa.gov/citations/20230012868
[7] NASA. “Langley Aerodrome Created to Explore Urban Air Mobility.” Official LA-8 testbed article and photographs, 25 April 2019; updated 22 December 2023. https://www.nasa.gov/aeronautics/langley-aerodrome-created-to-explore-urban-air-mobility/
[8] Linkage Electronics. “12S 90000mAh Solid-State HV Battery.” Product page and soft-pouch UAV battery photograph. Accessed 4 August 2026. https://lkghk.com/product/2286/